
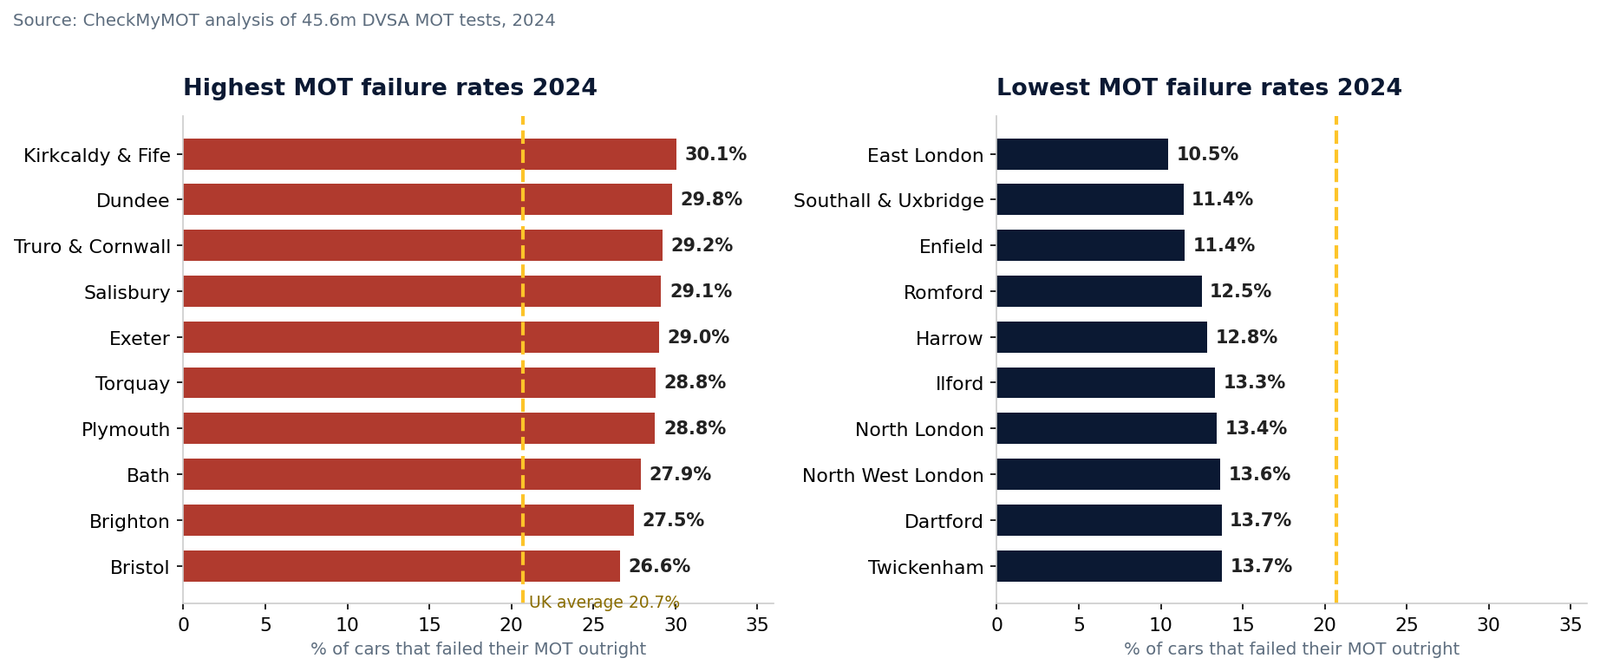
Book your car into an MOT in Kirkcaldy, and there is close to a one-in-three chance it comes back with a fail sheet. Book the same test in East London and the chance drops to nearer one in ten.
That is the headline from our analysis of every car MOT carried out in Great Britain in 2024 — all 45.6 million of them, from the DVSA’s official test records. Where a car is tested turns out to be one of the strongest predictors of whether it passes, and the map splits Britain into two very different countries: a high-failure west and north, and a low-failure London and south east.
Nationally, 20.7% of cars failed their MOT outright in 2024. Add in the cars that only passed after a repair at the station, and 25.9% of cars arrived at the test centre with at least one failure-level defect. But that average hides a gap of almost 20 percentage points between the best and worst areas in the country.
The failure hotspots: Scotland and the South West
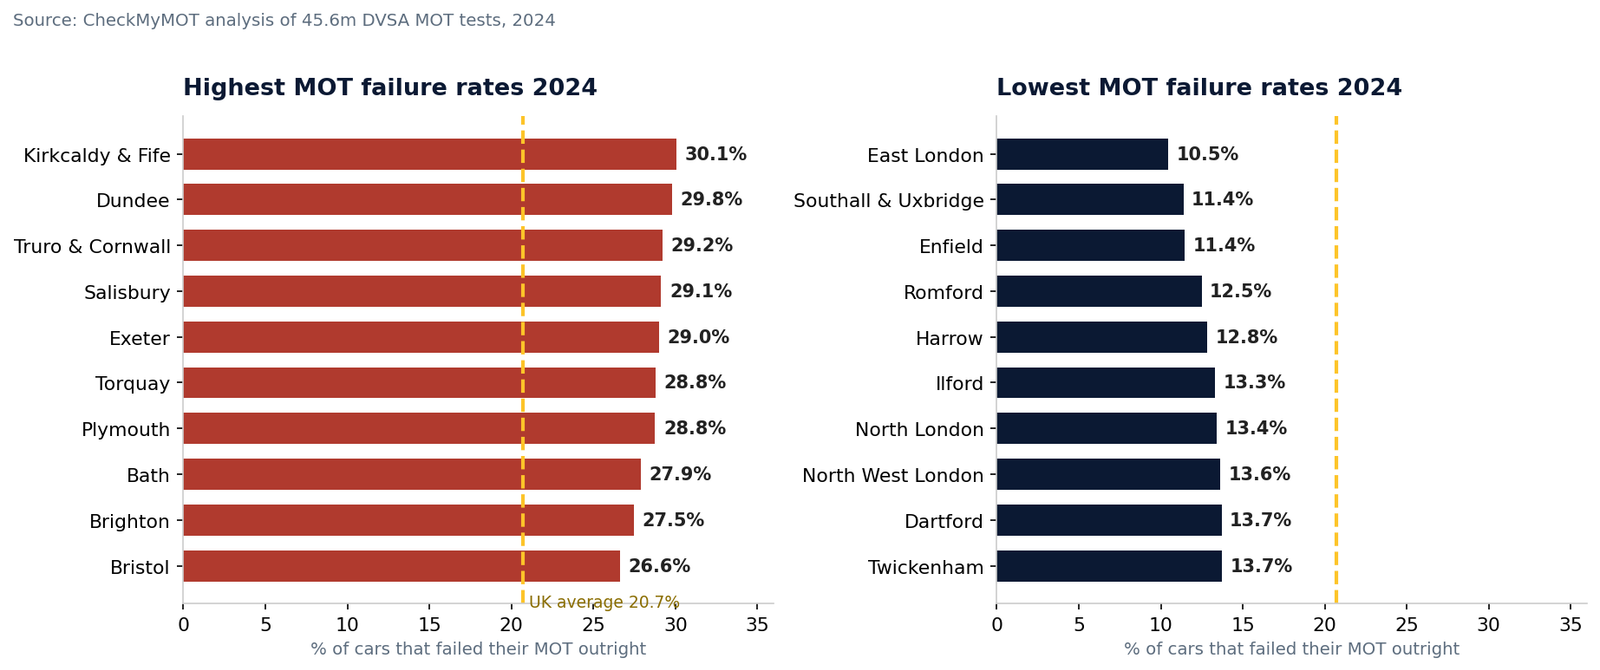
The hardest places in Britain to pass an MOT are Kirkcaldy and Fife (30.1% failed outright), Dundee (29.8%) and a block of South West areas — Truro and Cornwall (29.2%), Salisbury (29.1%), Exeter (29.0%), Torquay (28.8%) and Plymouth (28.8%). Four of the six worst areas in Britain are in Devon and Cornwall.
| Area | Tests in 2024 | Failed outright | Failed as presented* |
|---|---|---|---|
| Kirkcaldy & Fife (KY) | 273,722 | 30.1% | 33.2% |
| Dundee (DD) | 211,076 | 29.8% | 32.5% |
| Llandrindod Wells (LD) | 40,487 | 29.3% | 34.5% |
| Truro & Cornwall (TR) | 274,230 | 29.2% | 33.6% |
| Salisbury (SP) | 213,097 | 29.1% | 33.7% |
| Exeter (EX) | 502,734 | 29.0% | 34.6% |
| Torquay (TQ) | 220,033 | 28.8% | 34.1% |
| Plymouth (PL) | 473,787 | 28.8% | 33.1% |
| Bath (BA) | 379,578 | 27.9% | 33.1% |
| Brighton (BN) | 553,338 | 27.5% | 32.3% |
| Bristol (BS) | 789,755 | 26.6% | 31.8% |
| Dorchester (DT) | 194,352 | 26.0% | 33.1% |
| Bournemouth (BH) | 494,093 | 25.9% | 31.6% |
| Portsmouth (PO) | 622,787 | 25.8% | 31.0% |
| Aberdeen (AB) | 450,459 | 25.5% | 28.4% |
Look at the worst list and a pattern jumps out: it is dominated by coastal and rural areas. Cars in places like Cornwall, Devon, Fife and Dundee tend to be older, cover more miles between services, and live in sea air that is unkind to brake pipes, suspension parts and bodywork. Compare like with like, though, and geography still matters — Edinburgh (24.5%) fails far more cars than Glasgow (19.7%), and Cardiff (25.4%) far more than Birmingham (15.8%).
Where cars sail through: the London effect
Every one of the ten lowest-failure areas in Britain is in London or its commuter belt. East London leads the country at 10.5%, followed by Southall and Uxbridge and Enfield, both at 11.4%. Across London as a whole, just 13.7% of cars failed — barely half the South West rate of 26.4%.
| Area | Tests in 2024 | Failed outright | Failed as presented* |
|---|---|---|---|
| East London (E) | 366,961 | 10.5% | 21.2% |
| Southall & Uxbridge (UB) | 310,961 | 11.4% | 19.7% |
| Enfield (EN) | 290,099 | 11.4% | 19.7% |
| Romford (RM) | 343,871 | 12.5% | 19.6% |
| Harrow (HA) | 254,336 | 12.8% | 19.5% |
| Ilford (IG) | 197,057 | 13.3% | 21.0% |
| North London (N) | 260,901 | 13.4% | 22.2% |
| North West London (NW) | 362,167 | 13.6% | 20.4% |
| Dartford (DA) | 324,146 | 13.7% | 22.0% |
| Twickenham (TW) | 367,846 | 13.7% | 19.9% |
| Croydon (CR) | 272,328 | 13.9% | 21.1% |
| Slough (SL) | 288,208 | 14.5% | 21.5% |
| Southend (SS) | 439,216 | 14.9% | 21.1% |
| South East London (SE) | 339,326 | 15.0% | 24.3% |
| Sutton (SM) | 81,884 | 15.1% | 21.0% |
London’s fleet is younger than anywhere else’s — the ULEZ has pushed older cars out — and London cars cover fewer miles a year, which means less wear on the parts that fail MOTs. There is a second, quirkier London effect in the data: London test centres record by far the highest rate of “pass after rectification” results, where a minor fault is fixed on the spot during the test. In East London, 10.7% of all tests ended that way. In Dundee it was just 2.7%. Same country, same test — a very different outcome for the driver.
The real culprit is not where you live — it is how old your car is
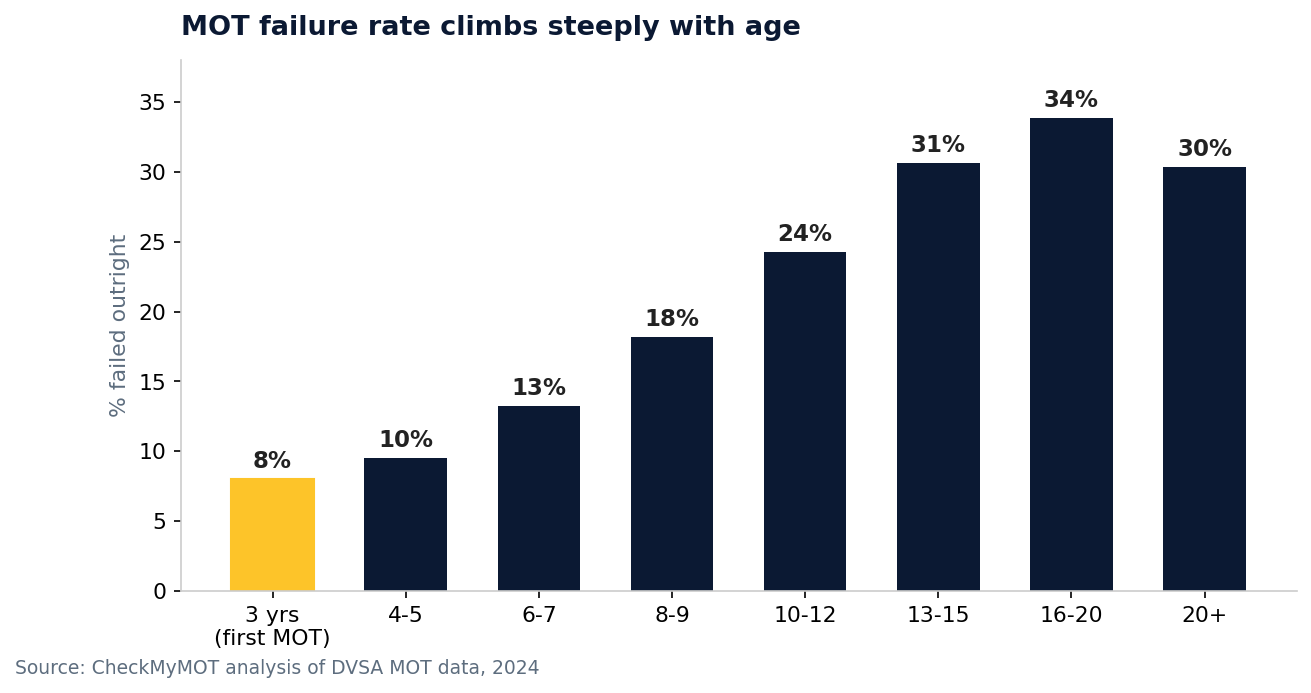
Geography matters, but age matters more. A car at its very first MOT, at three years old, has just an 8.0% chance of failing. By the time a car is 10 to 12 years old that has tripled to 24.2%, and cars aged 16 to 20 fail 33.9% of the time.
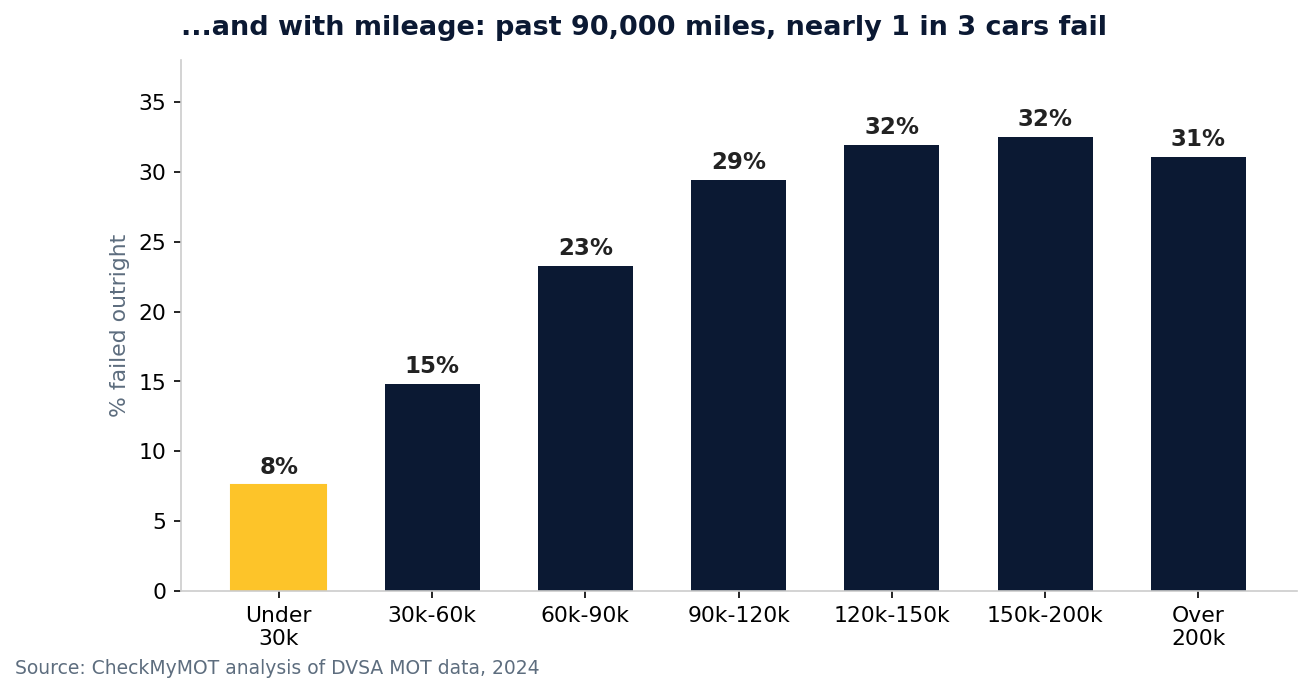
Mileage tells the same story. Cars under 30,000 miles fail 7.6% of the time. Once a car passes 90,000 miles, the failure rate jumps to around one in three — and stays there.
Do greener cars pass more easily?
Yes — by a wide margin. Hybrids recorded the lowest failure rate of any fuel type at 8.7%, and electric cars failed 10.9% of the time, roughly half the rate of petrol cars (20.6%) and diesels (22.4%). Some of that is the technology — no exhaust emissions test to fail, fewer moving parts, brakes that last longer thanks to regenerative braking. But be fair to the diesels: the electric and hybrid fleet is also much younger on average, and as the age figures above show, youth is the biggest MOT advantage of all.
What this means for your next MOT
Wherever you live, the cheapest MOT is the one your car passes first time. Three things genuinely move the odds:
- Check the car’s record before you book. Your car’s past failures and advisories are the best clue to what will fail next. Run your registration through our free MOT history checker and look at what testers have flagged before.
- Do the five-minute driveway check. Lights, tyres, wipers, washers and the horn account for a big share of cheap, silly failures. Ten minutes with a torch beats a retest fee.
- Book early, and don’t let it lapse. You can MOT your car up to a month early and keep your renewal date — our guide to how early you can MOT your car explains how. And remember the test itself is capped: here is the maximum MOT price if you are being quoted more.
Due a test soon? Find a test centre near you in our MOT Centres, check your car’s road tax while you are at it, and set a free reminder so next year’s test does not sneak up on you.
The full table: every postcode area ranked
Every postcode area in Great Britain with at least 20,000 car MOTs in 2024, ranked from highest to lowest outright failure rate. “Failed as presented” includes cars that failed plus cars that only passed after a repair at the station — the DVSA’s initial-failure measure.
| Area | Tests in 2024 | Failed outright | Failed as presented* |
|---|---|---|---|
| Kirkcaldy & Fife (KY) | 273,722 | 30.1% | 33.2% |
| Dundee (DD) | 211,076 | 29.8% | 32.5% |
| Llandrindod Wells (LD) | 40,487 | 29.3% | 34.5% |
| Truro & Cornwall (TR) | 274,230 | 29.2% | 33.6% |
| Salisbury (SP) | 213,097 | 29.1% | 33.7% |
| Exeter (EX) | 502,734 | 29.0% | 34.6% |
| Torquay (TQ) | 220,033 | 28.8% | 34.1% |
| Plymouth (PL) | 473,787 | 28.8% | 33.1% |
| Bath (BA) | 379,578 | 27.9% | 33.1% |
| Brighton (BN) | 553,338 | 27.5% | 32.3% |
| Bristol (BS) | 789,755 | 26.6% | 31.8% |
| Dorchester (DT) | 194,352 | 26.0% | 33.1% |
| Bournemouth (BH) | 494,093 | 25.9% | 31.6% |
| Portsmouth (PO) | 622,787 | 25.8% | 31.0% |
| Aberdeen (AB) | 450,459 | 25.5% | 28.4% |
| Cardiff (CF) | 857,726 | 25.4% | 30.4% |
| Perth (PH) | 137,624 | 25.1% | 27.5% |
| Taunton (TA) | 288,495 | 25.1% | 30.5% |
| Gloucester (GL) | 544,021 | 25.0% | 29.2% |
| Lincoln (LN) | 275,357 | 24.9% | 28.9% |
| Newport (NP) | 421,089 | 24.5% | 29.2% |
| Edinburgh (EH) | 622,000 | 24.5% | 27.4% |
| Hull (HU) | 336,754 | 24.4% | 28.2% |
| Inverness (IV) | 212,146 | 24.3% | 27.2% |
| Swindon (SN) | 360,236 | 24.1% | 28.6% |
| Swansea (SA) | 625,266 | 24.0% | 29.6% |
| Norwich (NR) | 608,702 | 23.9% | 28.6% |
| Paisley (PA) | 193,263 | 23.8% | 27.2% |
| Canterbury (CT) | 361,402 | 23.8% | 28.4% |
| Chester (CH) | 486,968 | 23.4% | 27.9% |
| Huddersfield (HD) | 188,945 | 23.3% | 27.4% |
| Llandudno & North Wales coast (LL) | 456,820 | 23.2% | 28.1% |
| Sunderland (SR) | 146,636 | 23.0% | 26.6% |
| Blackpool (FY) | 183,646 | 23.0% | 27.7% |
| Galashiels (TD) | 94,129 | 22.9% | 27.9% |
| York (YO) | 454,479 | 22.9% | 26.7% |
| Stoke-on-Trent (ST) | 494,127 | 22.9% | 26.3% |
| Northampton (NN) | 546,772 | 22.7% | 28.1% |
| Falkirk (FK) | 201,869 | 22.6% | 25.7% |
| Ipswich (IP) | 528,464 | 22.1% | 27.8% |
| Southampton (SO) | 503,286 | 22.0% | 27.7% |
| Nottingham (NG) | 827,359 | 22.0% | 26.5% |
| Darlington (DL) | 243,881 | 21.8% | 26.5% |
| Lancaster (LA) | 220,200 | 21.8% | 27.1% |
| Colchester (CO) | 329,934 | 21.7% | 27.1% |
| Telford (TF) | 173,878 | 21.7% | 25.1% |
| Guildford (GU) | 549,293 | 21.6% | 27.1% |
| Leeds (LS) | 488,951 | 21.5% | 25.3% |
| Wigan (WN) | 212,823 | 21.4% | 26.8% |
| Cambridge (CB) | 300,979 | 21.3% | 26.6% |
| Hereford (HR) | 171,675 | 21.2% | 24.9% |
| Shrewsbury (SY) | 290,384 | 21.1% | 26.2% |
| Oxford (OX) | 540,412 | 21.1% | 25.4% |
| Tunbridge Wells (TN) | 664,872 | 20.9% | 26.5% |
| Redhill & Crawley (RH) | 484,718 | 20.8% | 25.8% |
| Carlisle (CA) | 271,032 | 20.6% | 25.8% |
| Worcester (WR) | 248,408 | 20.5% | 25.2% |
| Kilmarnock (KA) | 306,185 | 20.4% | 24.5% |
| Motherwell (ML) | 257,640 | 20.4% | 23.3% |
| Crewe (CW) | 257,984 | 20.3% | 24.9% |
| Walsall (WS) | 310,366 | 20.2% | 25.7% |
| Warrington (WA) | 463,182 | 20.1% | 24.5% |
| Newcastle (NE) | 759,336 | 20.1% | 25.0% |
| Oldham (OL) | 314,604 | 20.1% | 24.4% |
| Manchester (M) | 693,667 | 20.1% | 26.6% |
| Watford (WD) | 166,731 | 20.1% | 23.7% |
| Teesside (Middlesbrough) (TS) | 420,732 | 20.0% | 25.3% |
| Wick & Orkney (KW) | 36,420 | 19.9% | 26.4% |
| Preston (PR) | 420,175 | 19.8% | 24.9% |
| Stockport (SK) | 446,556 | 19.7% | 24.7% |
| Glasgow (G) | 833,977 | 19.6% | 23.0% |
| Peterborough (PE) | 839,357 | 19.5% | 24.9% |
| Stevenage (SG) | 318,841 | 19.5% | 25.4% |
| Doncaster (DN) | 608,887 | 19.4% | 24.1% |
| Bradford (BD) | 453,220 | 19.3% | 24.2% |
| Bolton (BL) | 379,163 | 19.3% | 23.3% |
| Wakefield (WF) | 395,052 | 19.3% | 23.5% |
| Dumfries (DG) | 112,447 | 19.2% | 23.7% |
| Liverpool (L) | 432,763 | 19.1% | 24.9% |
| Reading (RG) | 646,707 | 19.0% | 24.0% |
| Harrogate (HG) | 118,948 | 19.0% | 22.3% |
| Milton Keynes (MK) | 455,057 | 19.0% | 24.6% |
| Halifax (HX) | 105,862 | 18.7% | 25.5% |
| Durham (DH) | 249,470 | 18.6% | 23.0% |
| Leicester (LE) | 761,738 | 18.5% | 23.8% |
| Medway & Maidstone (ME) | 572,095 | 18.5% | 25.9% |
| St Albans (AL) | 197,568 | 18.3% | 23.1% |
| Derby (DE) | 621,953 | 18.3% | 22.9% |
| Dudley (DY) | 287,873 | 18.1% | 24.3% |
| Coventry (CV) | 615,885 | 18.1% | 23.3% |
| Wolverhampton (WV) | 313,741 | 17.8% | 24.3% |
| Chelmsford (CM) | 569,855 | 17.2% | 22.7% |
| Sheffield (S) | 1,100,611 | 17.0% | 22.0% |
| Blackburn (BB) | 422,522 | 17.0% | 22.4% |
| High Wycombe (HP) | 502,525 | 16.8% | 22.7% |
| West London (W) | 116,160 | 16.3% | 21.9% |
| South West London (SW) | 190,841 | 16.3% | 21.6% |
| Kingston upon Thames (KT) | 334,853 | 16.2% | 21.4% |
| Luton (LU) | 261,268 | 16.1% | 23.8% |
| Birmingham (B) | 1,352,246 | 15.8% | 23.0% |
| Bromley (BR) | 173,244 | 15.2% | 20.4% |
| Sutton (SM) | 81,884 | 15.1% | 21.0% |
| South East London (SE) | 339,326 | 15.0% | 24.3% |
| Southend (SS) | 439,216 | 14.9% | 21.1% |
| Slough (SL) | 288,208 | 14.5% | 21.5% |
| Croydon (CR) | 272,328 | 13.9% | 21.1% |
| Twickenham (TW) | 367,846 | 13.7% | 19.9% |
| Dartford (DA) | 324,146 | 13.7% | 22.0% |
| North West London (NW) | 362,167 | 13.6% | 20.4% |
| North London (N) | 260,901 | 13.4% | 22.2% |
| Ilford (IG) | 197,057 | 13.3% | 21.0% |
| Harrow (HA) | 254,336 | 12.8% | 19.5% |
| Romford (RM) | 343,871 | 12.5% | 19.6% |
| Enfield (EN) | 290,099 | 11.4% | 19.7% |
| Southall & Uxbridge (UB) | 310,961 | 11.4% | 19.7% |
| East London (E) | 366,961 | 10.5% | 21.2% |
* “Failed as presented” = failed outright + passed after rectification at the station (PRS), as a share of all normal car MOT tests.
How we crunched the numbers
We analysed the DVSA’s anonymised MOT test results for 2024, published under the Open Government Licence: 45,573,249 normal (first-presentation) tests of class 4 vehicles (cars and small vans up to 3,000kg), excluding retests, aborted and refused tests. Each test is assigned to the postcode area of the test centre where it took place — so an area’s rate describes cars tested there. “Failed outright” means the recorded result was a fail; a further 2,386,448 cars (5.2%) passed only after rectification at the station. Vehicle age is calculated from the recorded first-use date; fuel figures combine the DVSA’s electric and hybrid categories. Areas with fewer than 20,000 tests in 2024 are excluded from the rankings to keep the comparisons fair.
Data: DVSA anonymised MOT tests and results, 2024. Analysis: CheckMyMOT, October 2026.
Which town has the highest MOT failure rate in the UK?
Kirkcaldy and Fife (postcode area KY) recorded the highest outright MOT failure rate in 2024: 30.1% of cars tested there failed, from 273,722 tests. Dundee was second at 29.8%.
What percentage of cars fail their MOT first time?
In 2024, 20.7% of cars in Great Britain failed their MOT outright. Including cars that only passed after a repair at the station, 25.9% of cars arrived at the test with a failure-level defect.
Do electric cars fail the MOT less often than petrol and diesel cars?
Yes. Electric cars failed 10.9% of tests in 2024 and hybrids just 8.7%, compared with 20.6% for petrol and 22.4% for diesel cars — partly because the electric fleet is younger on average.
At what age is a car most likely to fail its MOT?
Failure rates climb steeply with age: 8.0% for cars at their first MOT aged three, 24.2% at 10 to 12 years, and 33.9% for cars aged 16 to 20 years.